Earth Intelligence for Assets, Infrastructure, and Risk
Know where the ground is moving before the risk becomes visible.
WorldNerve uses satellite radar and InSAR analysis to help insurers, property owners, engineers, and infrastructure operators understand historical ground movement, screen assets, and prioritise further investigation.
Persistent-scatterer velocity field · demonstration data
PhD-led
Scientific Interpretation
Remote sensing expertise applied to every result.
4 systems
Radar & Processing Experience
Sentinel-1, TerraSAR-X, COSMO-SkyMed & PSInSAR.
Global
Suitable Radar Coverage
International analysis wherever the archive supports it.
The problem
Ground Risk Decisions Are Made with a Blind Spot
Traditional review methods answer what a site looks like today. They rarely answer how it has been behaving.
The Missing Dimension
Satellite archives preserve a movement history that inspections cannot recreate later.
See onset, trend, seasonal behaviour, and local context before deciding where closer investigation is justified.
Blind Spot 01
Movement Develops Between Inspections
Gradual change can continue for years before visible symptoms appear.
Blind Spot 02
Inspections Show Today
A site visit cannot reconstruct how an asset behaved before that date.
Blind Spot 03
Portfolios Resist Manual Review
Hundreds of assets cannot be assessed consistently through site visits alone.
Blind Spot 04
Claims Lack a Historical Record
Teams often need evidence from before a loss, policy period, or trigger date.
Blind Spot 05
Hazard Maps Are Too Broad
Regional susceptibility does not reveal the behaviour of a specific asset.
Blind Spot 06
Property Data Has No Time Dimension
Age, soil, and construction attributes rarely show whether the ground moved.
The approach
From location to evidence in five steps
Radar satellites have been imaging most of the world every few days for a decade. We turn that archive into asset-level movement evidence.
Submit a location
A property, portfolio, or area of interest — an address or coordinates is enough to start.
Data assessment
Available satellite radar archives and measurement conditions are reviewed for the site.
Processing & QC
Ground movement is processed from the radar time series and quality checked.
Interpretation
Results are interpreted in the context of the asset and its surroundings.
Clear report
Maps, trends, limitations, and recommended next steps — written for decision-makers.
We analyse satellite radar observations to identify where measurable ground movement has occurred and how it has changed over time — often reaching back to 2014 or earlier, even for sites nobody was monitoring.
Every result is interpreted in context: how the asset behaves relative to its surroundings, what the data quality supports, and what it does not.
Read the full methodologyUse cases
Built for decisions, not dashboards
Use historical movement evidence to prioritise inspections, review assets, and focus technical investigation.
Insurance underwriting
Historical movement context for referral decisions, inspection triggers, and risk selection on subsidence-exposed business.
Learn moreClaims investigation support
Independent, dated evidence of how a site moved before and after a reported loss — supporting, not deciding, the investigation.
Learn moreCommercial property due diligence
Movement history for acquisitions, developments, and lending decisions, compared against the surrounding area.
Learn moreInfrastructure monitoring
Screening of rail, road, pipeline, and utility networks so inspection effort concentrates on moving sections.
Learn morePortfolio screening
Consistent movement indicators across hundreds or thousands of locations, ranked for further review.
Learn moreEngineering & geotechnical support
A historical deformation layer that complements site investigation, instrumentation, and structural assessment.
Learn moreCommercial formats
Three practical ways to engage
Single-Site Assessment
One property, facility, development, or infrastructure location.
- Site location map
- Historical ground movement screening
- Velocity and displacement maps
- Time-series plots
- Surrounding-area comparison
- Data availability assessment
Portfolio Screening
Multiple properties, assets, or insured locations.
- Portfolio-wide risk screening
- Asset prioritisation
- Movement indicators per location
- Regional comparison
- Ranked review list
- Exportable tables
Ongoing Monitoring
Clients who need repeated observations over time.
- Periodic deformation updates
- Change alerts
- Time-series tracking
- New movement identification
- Portfolio monitoring summaries
- Technical consultation
Full deliverable lists on the Reports page.
Deliverables
What a report may include
Exact contents depend on the site, the data, and the question — every inclusion is listed and explained.
- Ground velocity map
- Displacement time series
- Historical movement summary
- Nearby reference comparison
- Data quality and confidence notes
- Asset-level interpretation
- Technical appendix
- Recommended next actions
Real-data sample report
See Exactly How a Portfolio Becomes a Decision Queue
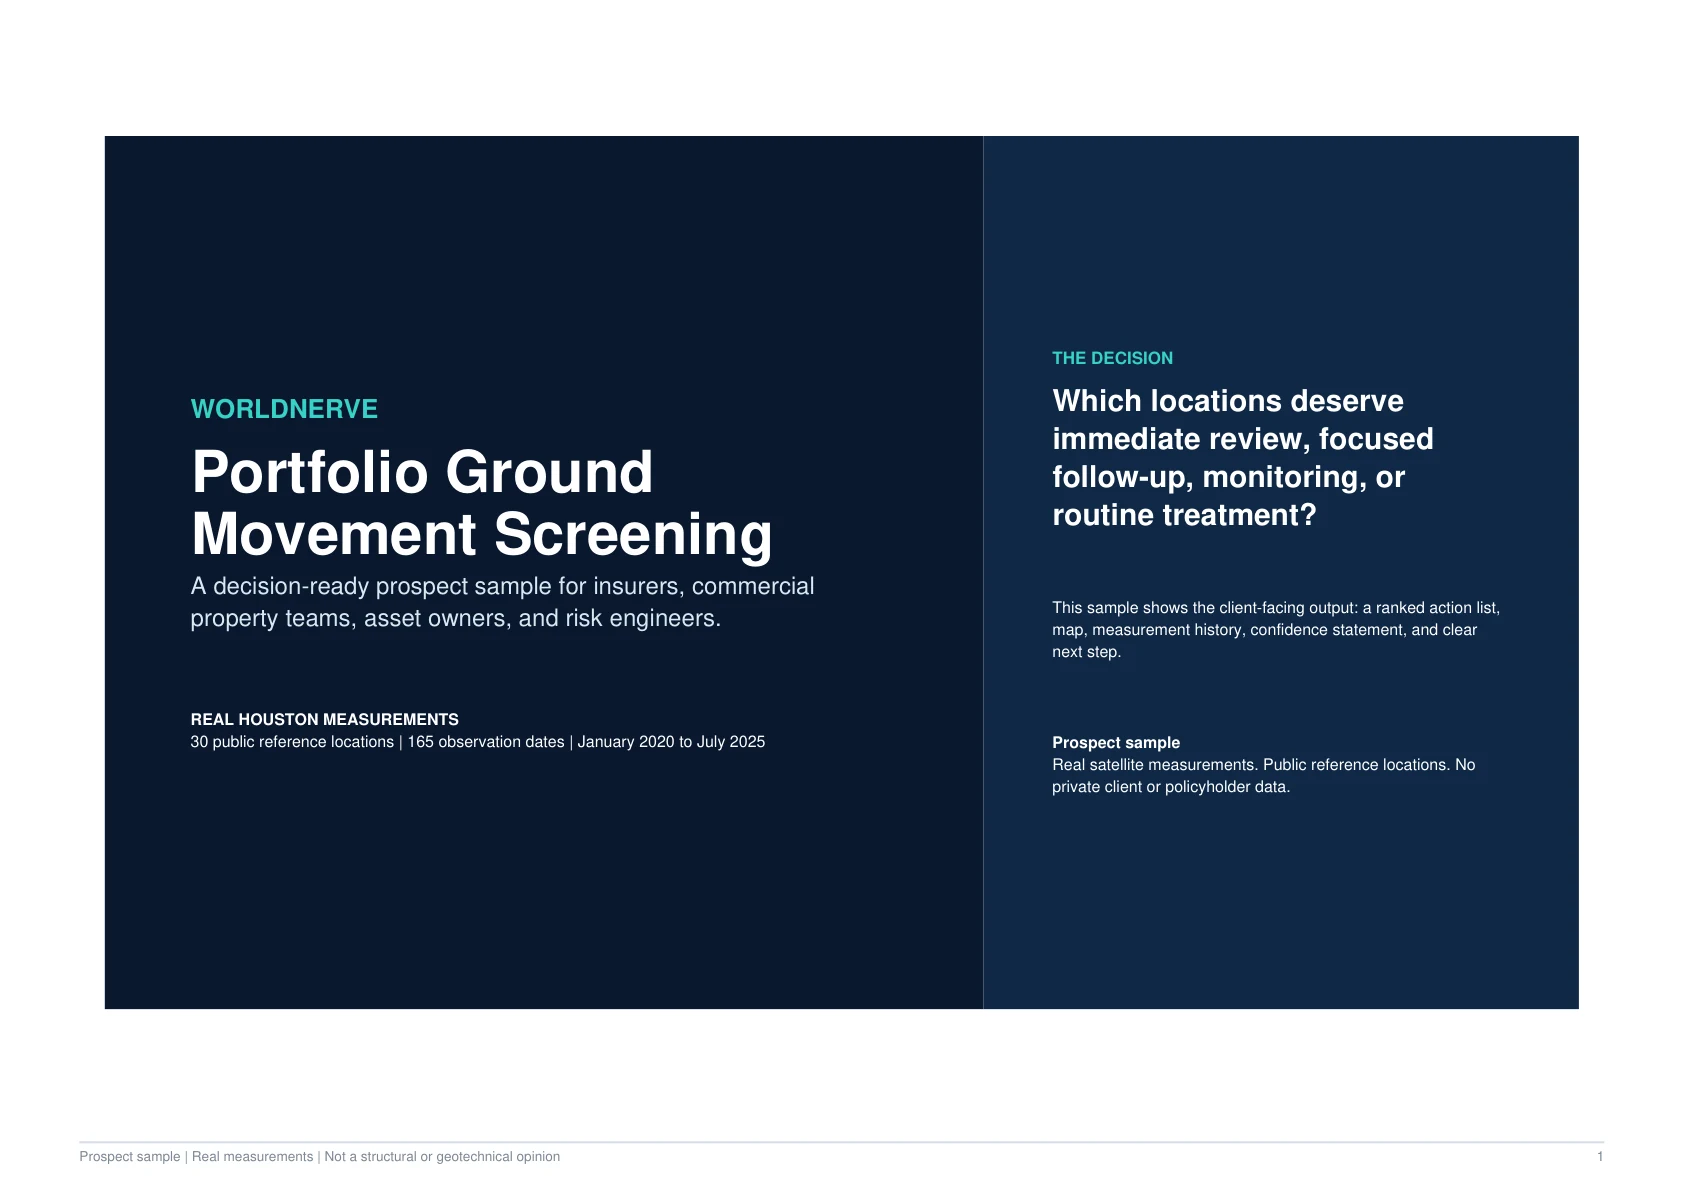
A complete report built from real Houston satellite measurements and public reference locations, with the same evidence, confidence, and limitations expected in a live deliverable.
Inside the Sample
A ranked decision queue backed by visible evidence.
The sample uses real satellite measurements and public reference locations to demonstrate the structure and transparency of a WorldNerve portfolio screening deliverable without exposing private client data.
- 30-location ranked action register
- Immediate, focused, monitor, and routine outcomes
- Portfolio movement and referral map
- Evidence history behind a referred location
- Routine-location comparison
- Confidence, limitations, and client-ready outputs
9-Page PDF
Real Measurements
Public Locations
Claims, insurance, property, infrastructure, municipal, and monitoring samples are available in the full report library.
Who you work with
Specialist analysis, personally delivered
Photo placeholder
Dr. Zeeshan Afzal
Remote Sensing and InSAR Specialist
Dr. Zeeshan Afzal is a remote sensing researcher specialising in SAR, InSAR, and PSInSAR time-series analysis, urban deformation, subsidence, infrastructure monitoring, and satellite-based geohazard assessment.
His research experience spans multi-temporal InSAR and persistent scatterer analysis, urban growth and deformation studies, and earthquake-related change assessment — the same methods WorldNerve applies to commercial property and infrastructure questions.
Common questions
Asked by underwriters, engineers, and asset managers
What is InSAR?
InSAR (Interferometric Synthetic Aperture Radar) is a technique that compares radar images acquired by satellites at different times. By analysing the phase difference between acquisitions, it is possible to estimate how the ground surface has moved along the satellite's line of sight — often at the level of millimetres to centimetres per year, depending on conditions.
Can satellite data detect subsidence at an individual property?
Often, yes — but it depends on the site. InSAR relies on stable radar-reflective features such as buildings, hard surfaces, and exposed structures. Urban and industrial sites usually offer good measurement points; heavily vegetated or frequently changing surfaces may offer few or none. The first step of every engagement is a data availability review that tells you what is measurable before any commitment.
How accurate are the measurements?
Achievable precision depends on data availability, surface characteristics, atmospheric conditions, viewing geometry, processing method, temporal coverage, and validation. Under favourable conditions, multi-temporal InSAR velocity estimates can reach millimetre-per-year precision, but this cannot be assumed universally. Every report documents the confidence level and uncertainty of its measurements.
Does ground movement mean a building is damaged?
No. Measured surface displacement does not automatically indicate structural damage, and the absence of measured movement does not guarantee absence of risk. Satellite analysis identifies where and how the surface has moved; assessing structural condition requires engineering inspection. Our reports are designed to help prioritise those inspections, not replace them.
Can the analysis identify the cause of subsidence?
Satellite data alone cannot conclusively determine causation. Spatial and temporal patterns can be consistent with certain mechanisms — for example seasonal signals, mining-related settlement, or groundwater-related movement — and we interpret them carefully in context. Confirming cause typically requires geotechnical, geological, hydrological, or engineering investigation.
How much historical data is available?
Sentinel-1 provides free, systematic global coverage from late 2014 onwards, typically every 6–12 days in most regions. Earlier or higher-resolution archives (e.g. TerraSAR-X, COSMO-SkyMed, ERS/Envisat) exist for many areas but vary by location. The data availability review establishes exactly what archive exists for your site.
More answers on the methodology page.
Low-risk pilot
Start with one location.
Before committing to a larger project, submit one property, facility, or infrastructure site for an initial review. We will assess available satellite coverage, explain what analysis may be feasible, and recommend the most appropriate next step.
Not every site can be analysed successfully — measurement depends on surface characteristics and data coverage. The pilot review tells you honestly whether analysis is worthwhile before you spend anything on it.
Start a conversation
Have a property, asset portfolio, or infrastructure site you want to review?
Submit the location and receive an initial assessment of data availability and project suitability.